The Tuba Sound
How Much Fundamental is in your Sound?
Tuba players all strive, or at least say they strive, for a sound rich in fundamental. They also talk about color in their sound. But the mind plays tricks on us, and what we think is a sound rich in fundamental may be fooling us because of the richness of the overtones. That is the subject of this article.
The Setup
The sounds sampled for this article were made by me on a York Master BBb tuba and on a Miraphone 186 BBb tuba. These two instruments are compared and illustrated here. They were recorded to a Sony MZR70PC portable minidisc recorder using an Audio Technica AT-822 microphone. The "studio" was my basement, which colors the sound somewhat, but in ways presumed to be similar for all the comparisons done here. The minidisc recordings were remastered to computer disk using a Santa Cruz Turtle Beach sound card, which is considered the best audio equipment available for home use. The sound editing software is the excellent Cool Edit 2000, which provides a number of useful features for this analysis. The microphone was placed six feet off the ground and six feet in front of the tuba.
All the equipment has a flat frequency response in the range used in this article, within a fraction of a dB. The effects we will be considering are much larger, so I will assume that the electronics have no significant effect on the information presented here.
The Analysis
The question for non-scientists is this: How do you analyze sound in useful ways? First, let's define sound. We hear vibrations of our eardrums, which are set to vibrating by pressure waves or fronts in the air which surrounds us. That air is set to vibrating by the noise-making device. We can represent those pressure waves with a series of numbers, which is called a time series. The reason we do it is to analyze it in the frequency domain. We perceive vibrations at a particular frequency as having a particular pitch. But it isn't quite as simple as that.
All acoustical musical instruments produce a number of different frequencies that resonate with each other. This resonance is spread across a wide spectrum of sound frequencies, so that the sound we hear is actually the sum of a variety of harmonic pitches. The frequency and strength of each of these harmonics is what defines the color of the sound we hear.
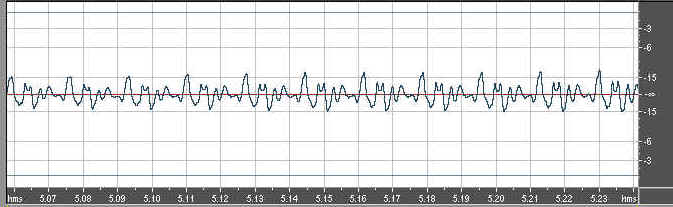
Let's start the analysis with a low Bb, below the bass clef, as produced by me on the York Master tuba. If we zoom into a small sample of the sound using Cool Edit 2000, we see a waveform that looks like this:
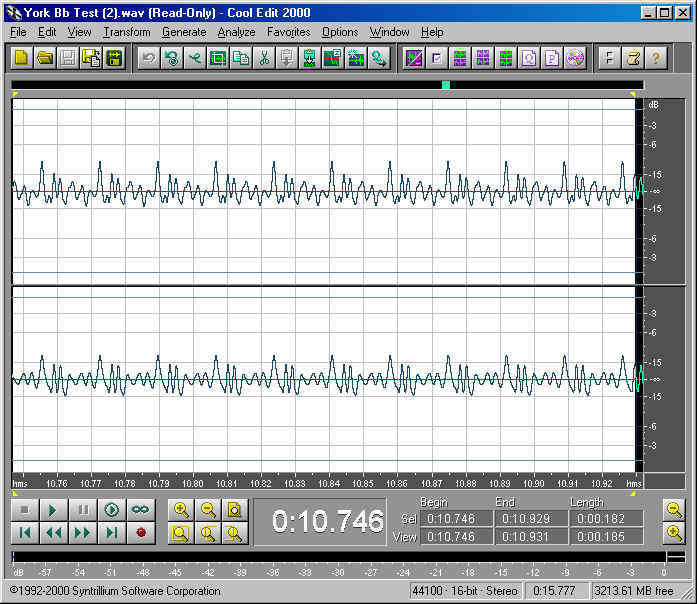
As you can see, the main beats are clearly visible. These are caused by the flapping of our lips in the mouthpiece. We can determine, using the time line at the bottom, the start time and end time of ten of these repeating patterns. The reciprocal of one-tenth this value gives us the frequency, which in this case is 58.8 Hz. Notice that between the main bumps in the waveform reside a number of smaller bumps, also in repeating patterns. These are probably added by resonance within the tuba. At what frequencies and at what strength are all these bumps? We could measure a sample of these waveforms in microscopic detail and figure it out, or we could apply a mathematical method used for such spectral analysis known as a Fourier Transform. Fortunately, Cool Edit 2000 has such a spectral analysis built into it.
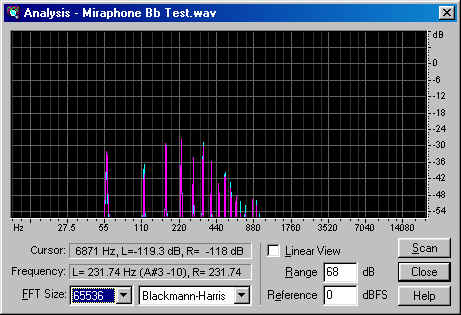
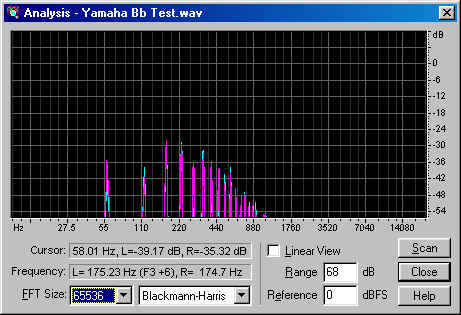
Here's the spectrum for the note shown above.
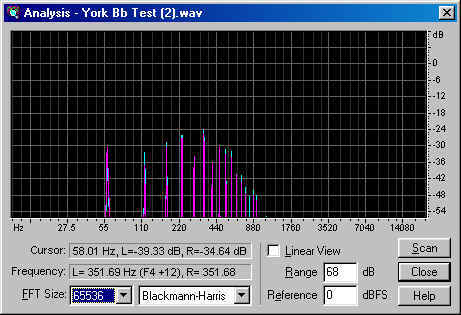
We see the fundamental frequency at about 59 Hz, and we see that the sound contains strong components at higher frequencies. These frequencies are the multiples of that fundamental tone. Picking numbers off the spectrum, we get the following table:
| York Master Low Bb | Miraphone 186 Low Bb | York Master High Bb | ||||||
| Overtone | Frequency (Hz) | Loudness (dB) | Overtone | Frequency | Loudness | Overtone | Frequency | Loudness |
| 1 | 59 | -30 | ||||||
| 2 | 118 | -33 | ||||||
| 3 | 176 | -27 | ||||||
| 4 | 235 | -26 | ||||||
| 5 | 294 | -35 | ||||||
| 6 | 353 | -25 | ||||||
| 7 | 412 | -36 | ||||||
| 8 | 470 | -30 | ||||||
| 9 | 529 | -33 | ||||||
| 10 | 588 | -33 | ||||||
| 11 | 647 | -40 | ||||||
| 12 | 706 | -40 | ||||||
| 13 | 764 | -46 | ||||||
| 14 | 823 | -46 | ||||||
| 15 | 882 | -48 | ||||||
| 16 | 941 | -48 | ||||||
You can see from the empty parts of the table where we are going with this, heh, heh. For now, though, let's ponder the numbers for this one note. The strongest overtones are the sixth, fourth, and third. At -30 dB (and considering that decibels are a logarithmic scale), the fundamental is half the loudness of the third harmonic.
So, why do we hear a low Bb, if the actual low Bb is so weak in the overall mix? The reason will become clear when we look at the spectra and waveforms for the high Bb.
At the same scale, here is the Cool Edit representation of the waveform for a high Bb, as played on the York master:
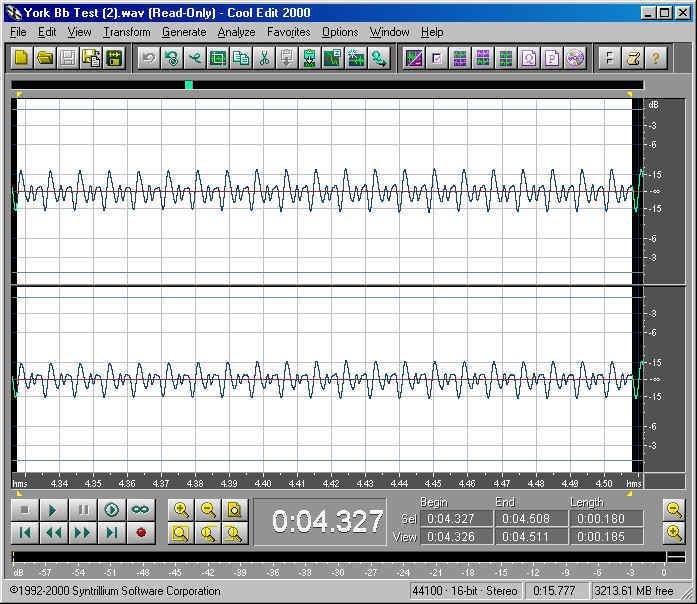
This time, we count 20 cycles and determine the frequency to be 114.9 Hz, which is a little flat compared to the low Bb. This is an intonation quirk on this horn that I made no attempt to correct in order to get the most centered sound. (That's my story and I'm sticking with it.)
Now, let's take a look at the spectrum for the high Bb:
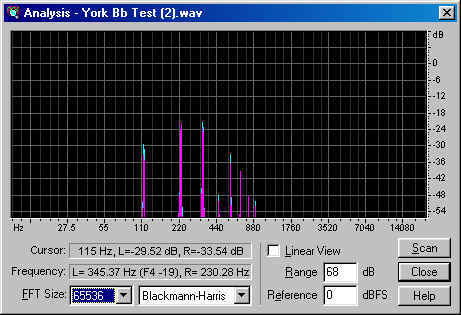
Whoa! What's going on here? Where are all the overtones? Ah, now we understand why we hear a low Bb as a low Bb, and not as a high Bb, even if the fundamental were completely gone. The high Bb contains its fundamental, at 115 Hz, and its overtones every 115 Hz above that. So, it matches frequencies with the low Bb only on every other overtone. Filling in (and making a few changes) in our table, here's what the numbers look like:
| York Master Low Bb | Miraphone 186 Low Bb | York Master High Bb | ||||||
| Overtone | Frequency (Hz) | Loudness (dB) | Overtone | Frequency | Loudness | Overtone | Frequency | Loudness |
| 1 | 59 | -30 | 1 | 115 | -30 | |||
| 2 | 118 | -33 | ||||||
| 3 | 176 | -27 | 2 | 230 | -22 | |||
| 4 | 235 | -26 | ||||||
| 5 | 294 | -35 | 3 | 345 | -22 | |||
| 6 | 353 | -25 | ||||||
| 7 | 412 | -36 | 4 | 460 | -48 | |||
| 8 | 470 | -30 | ||||||
| 9 | 529 | -33 | 5 | 575 | -33 | |||
| 10 | 588 | -33 | ||||||
| 11 | 647 | -40 | 6 | 690 | -40 | |||
| 12 | 706 | -40 | ||||||
| 13 | 764 | -46 | 7 | 805 | -48 | |||
| 14 | 823 | -46 | ||||||
| 15 | 882 | -48 | 8 | 920 | -50 | |||
| 16 | 941 | -48 | ||||||
The loudest overtones are the second and third, which correspond to the fourth and sixth overtones of the low Bb, which are, not surprisingly, the loudest overtones of that note. So, the tone has a characteristic set of overtone loudnesses that follows an approximately similar shape, irrespective of frequency. This is the sound of the York Master, as played by Rick Denney.
So, we know that a low Bb is being played because that most effective spectrum analyzer, our combination of ears and brain, interprets all those overtones as low Bb. Even if we removed the fundamental, by, say, recording on a cheap microphone that wasn't sensitive at 58 Hz, we would still perceive the result as a (bad-sounding) low Bb. If I could produce a powerful pedal Bb, which I can't, I could demonstrate something Frederick J. Young has been torturing tuba players like himself with for years: The pedal tones on a tuba contain almost no fundamental. They sound like a pedal because of the richness of the overtones.
Let me add an alternate description, based on something said by a thoughtful reviewer. It is quite likely that our eardrums vibrate at 59 Hz because the spacing of the overtones is at precise 59-Hz intervals. This spacing produces what is called a difference tone of 59 Hz. Difference tones are powerful stuff: Fog horns at sea sound deep, but they are actually produced by the difference tone between two high-pitched sirens with different frequencies. So our brain hears a Bb because that's exactly what our eardrums are vibrating, based on the difference tones.
A Comparison
Now, let's compare the spectra from the York Master and the Miraphone, to see if we can quantify what our ears tell us about how these instruments sound.
First, let's remind ourselves of the York Master low Bb waveform:
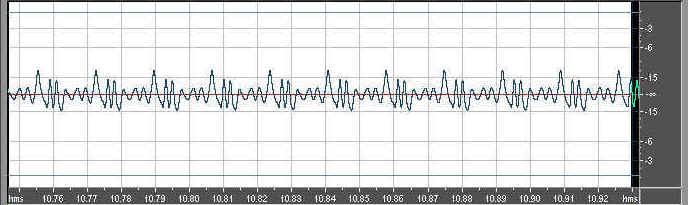
And here is the Miraphone low Bb waveform
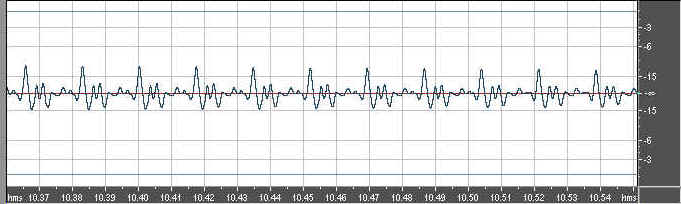
We can see right off the bat that the York Master's overtones contain more energy than the Miraphone's overtones. Before we draw conclusions, however, let's look at the spectra, starting with the York:
They are quite similar, though perhaps the York sample was played slightly louder than the Miraphone sample. But leaving that aside, the higher overtones are louder by a greater proportion than the lower overtones. Let's fill in the numbers on the table, and then I'll redefine some terms as a way of drawing some conclusions.
| York Master Low Bb | Miraphone 186 Low Bb | York Master High Bb | ||||||
| Overtone | Frequency (Hz) | Loudness (dB) | Overtone | Frequency | Loudness | Overtone | Frequency | Loudness |
| 1 | 59 | -30 | 1 | 58 | -32 | 1 | 115 | -30 |
| 2 | 118 | -33 | 2 | 115 | -38 | |||
| 3 | 176 | -27 | 3 | 173 | -30 | 2 | 230 | -22 |
| 4 | 235 | -26 | 4 | 231 | -28 | |||
| 5 | 294 | -35 | 5 | 288 | -34 | 3 | 345 | -22 |
| 6 | 353 | -25 | 6 | 346 | -29 | |||
| 7 | 412 | -36 | 7 | 403 | -36 | 4 | 460 | -48 |
| 8 | 470 | -30 | 8 | 461 | -43 | |||
| 9 | 529 | -33 | 9 | 519 | -40 | 5 | 575 | -33 |
| 10 | 588 | -33 | 10 | 576 | -44 | |||
| 11 | 647 | -40 | 11 | 634 | -48 | 6 | 690 | -40 |
| 12 | 706 | -40 | 12 | 692 | -50 | |||
| 13 | 764 | -46 | 13 | 749 | -52 | 7 | 805 | -48 |
| 14 | 823 | -46 | 14 | 807 | <-54 | |||
| 15 | 882 | -48 | 15 | 865 | -50 | 8 | 920 | -50 |
| 16 | 941 | -48 | 16 | 922 | -50 | |||
The principle overtones in the Miraphone sound are two or three dB lower than the York. But the high overtones, starting with the 8th and going up from there, are much lower than the York. On the face of it, we would assume this meant the Miraphone had a darker sound than the York. Yet, the York's sound is deeper to my ear and those who have heard both instruments. By deeper I mean that it seems to have more depth or bottom to it.
I would therefore like to define darker as having less prominent higher overtones, and deeper as having an overtone series that reads to the ear and brain as a deeper note. And now, at last, I understand why some orchestral players love the big American-style instruments. They praise their depth and color, and that color, with its more even range of overtones, is interpreted by the listener as deeper. And why others praise the dark, focused sound of the German-style instruments, which less emphasis on the overtones, and more of the sound coming from the core frequencies--those closer to the fundamental.
Another Comparison
Both the instruments so far are BBb instruments, playing a Bb. So, the note is played on the open bugle of the instruments, and both playing the second harmonic, which is an octave above the fundamental note of the bugle. What about a note that is not on the open bugle, and on a much smaller horn? Let's add the spectrum from a small Yamaha F tuba to the comparison.
Here is the waveform for the Yamaha:
As you can see, the waveform has more energy in the harmonics than the York, and much more than the Miraphone. But the spectrum shows us something more like we saw with the Miraphone...
...except that the Miraphone was relatively much stronger in the fundamental, and weaker at a few key frequencies, such as the 8th overtone, which is an octave of the fundamental.
Here are the numbers:
| York Master Low Bb | Miraphone 186 Low Bb | Yamaha YFB-621 Low Bb | ||||||
| Overtone | Frequency (Hz) | Loudness (dB) | Overtone | Frequency | Loudness | Overtone | Frequency | Loudness |
| 1 | 59 | -30 | 1 | 58 | -32 | 1 | 58 | -36 |
| 2 | 118 | -33 | 2 | 115 | -38 | 2 | 117 | -38 |
| 3 | 176 | -27 | 3 | 173 | -30 | 3 | 175 | -28 |
| 4 | 235 | -26 | 4 | 231 | -28 | 4 | 234 | -28 |
| 5 | 294 | -35 | 5 | 288 | -34 | 5 | 292 | -36 |
| 6 | 353 | -25 | 6 | 346 | -29 | 6 | 351 | -32 |
| 7 | 412 | -36 | 7 | 403 | -36 | 7 | 409 | -36 |
| 8 | 470 | -30 | 8 | 461 | -43 | 8 | 468 | -38 |
| 9 | 529 | -33 | 9 | 519 | -40 | 9 | 526 | -41 |
| 10 | 588 | -33 | 10 | 576 | -44 | 10 | 584 | -40 |
| 11 | 647 | -40 | 11 | 634 | -48 | 11 | 643 | -45 |
| 12 | 706 | -40 | 12 | 692 | -50 | 12 | 701 | -48 |
| 13 | 764 | -46 | 13 | 749 | -52 | 13 | 760 | -47 |
| 14 | 823 | -46 | 14 | 807 | <-54 | 14 | 818 | -50 |
| 15 | 882 | -48 | 15 | 865 | -50 | 15 | 877 | -52 |
| 16 | 941 | -48 | 16 | 922 | -50 | 16 | 936 | <-54 |
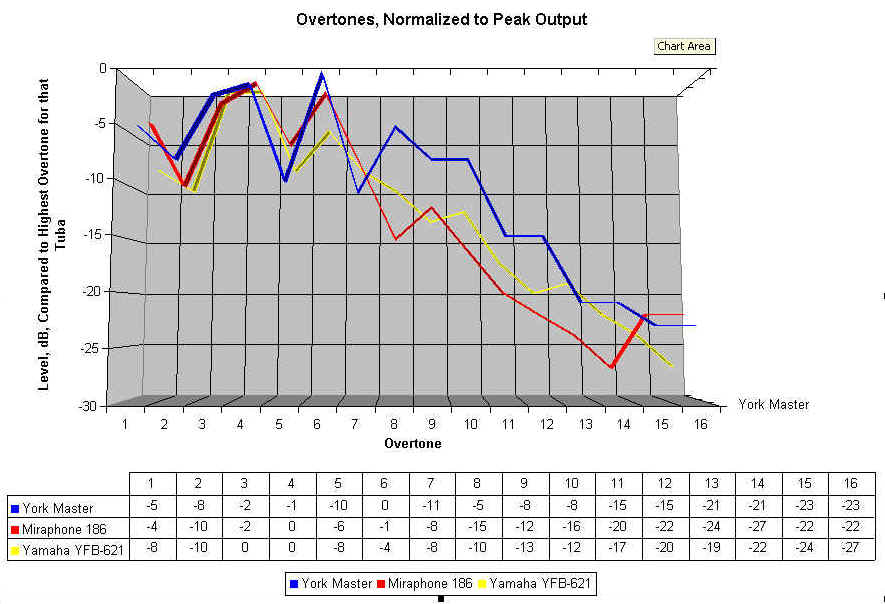
Yet another thoughtful reviewer suggested that the differences could be more clearly illustrated by normalizing the values to the loudest overtone for each tuba. We do that by subtracting the values above from the value for the loudest overtone. This should eliminate the effects of slight differences in the loudness at which the note was being played, and makes a direct comparison easier. In fact, we can put these normalized values on a chart, as I've done below:
If we subtract the loudness of the York Master overtones from all the numbers above, we can look at a similar chart, where any line below the zero point represents an overtone softer than produced by the York, and any line above the zero line is an overtone louder than produced by the York. Here's the graph:
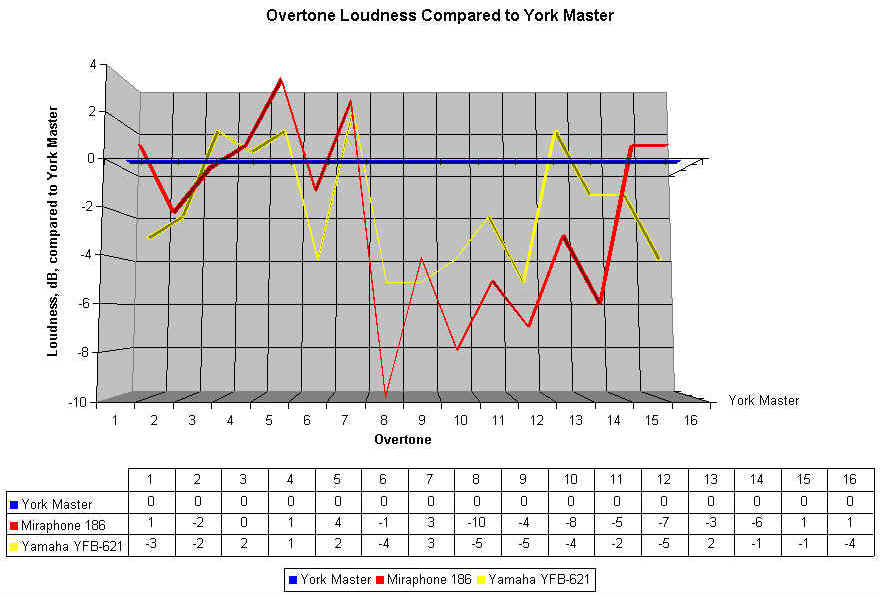
As we can see, both the Miraphone and the Yamaha are a bit stronger than the York in the fourth, fifth, and seventh overtones, and much weaker than the York in Overtones eight through twelve. The Miraphone stays below the York until the level are so low that it doesn't matter. Now I think I understand why those who enjoy the Miraphone sound seem to also be fond of the Yamaha 621, and why both may not be favored by those who desire the York-type sound.
To the ear of the hearer, the Yamaha has a rich low register, but it is, of course a small horn. At these volume levels, the differences are not dramatic. The test which suggests itself, and which was also suggested by a thoughtful reviewer, is to conduct these comparison at fortissimo, approaching the loudest dynamic on the tubas, to see how these horns differ, and perhaps to get a picture of what is happening as notes start to break up. Stay tuned.
Are we getting at something here? I don't know. One thing is for sure, modern home computer and recording technology has at last put into the hands of the curious the tools for interesting analysis. This can only help us gain a better understanding of the terms we use to express the concepts we promote. No longer will I use the phrase "rich in fundamental" to describe a deep-sounding tuba, and no longer will I be convinced that a tuba must produce low frequencies to sound lower.
There are more questions than answers here, but perhaps we will start asking better questions. That is my hope.